Is BTC Bound or Ready?
Playbook
•
July 28, 2025
Is BTC Bound or Ready?
Playbook
•
July 28, 2025

Bitcoin futures have clawed back from the June lows with strength — but the bulls are now running into serious friction. Price is trapped in a tight consolidation range between well-defined resistance and support zones, and the market is coiling for a breakout. The question is: Will BTC1 break out... or break down?
Current Market Structure
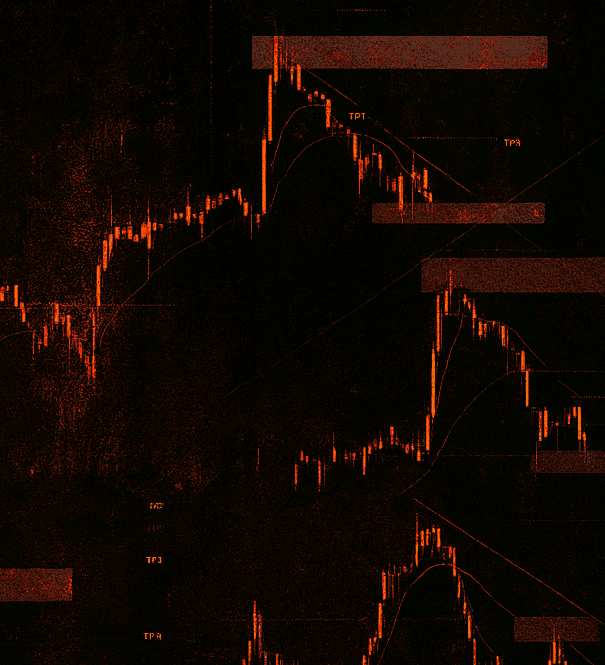
After a massive bounce off the 96,000–97,000 zone, BTC1 ripped higher and is now consolidating just below 109,000.
The structure shows a neutral range forming between roughly 109,000 (resistance) and 106,000 (support).
Buyers have defended the lower bound, but they’ve also failed to push above the upper bound — suggesting balance before expansion.
Key Levels
LevelZoneSignificanceResistance (R)108,800 – 109,800Supply zone. Price has failed to close above this range multiple times.Support (S)105,800 – 106,400Demand zone. Price bounced from this area several times; strong buyers here.Macro Pivot~103,000If broken, would confirm a shift back to bearish dominance.Upside Magnet~111,800–112,200If R breaks, price could rip toward this area quickly (inefficient zone).
Bias for the Week Ahead
Neutral to Bullish Bias
As long as BTC1 holds above 106,000, bulls remain in the game.
However, multiple rejections near resistance hint that institutional sellers are active.
A break of either side will likely trigger momentum and open up clean targets.
Trade Scenarios
Scenario 1: Bullish Breakout
Entry: Above 109,800 with strong momentum or breakout candle close
TP1: 111,800
TP2: 112,400+
SL: Below 108,500
This scenario plays the breakout and aims to capture the range expansion.
Scenario 2: Bearish Rejection from Resistance
Entry: Short around 109,400–109,800 if price rejects again
TP1: 106,600
TP2: 105,800
SL: Above 110,200
Ideal setup if BTC fails to gain strength early in the week and VIX or dollar strength returns.
Scenario 3: Range Play
Until a breakout occurs, the most likely scenario is continued chop between the marked zones.
Long near 106,000, SL under 105,500, TP near 108,800
Short near 109,800, SL above 110,200, TP near 106,400
This is suitable for day traders or range scalpers.
Summary Table
Bias Confidence Setup Trigger
✅ BullishModerateBreakout above 109,800
⚠️ BearishModerateRejection from 109,800 + loss of 106,000
⚪ NeutralHighWhile inside 106K–109K range
What to Watch This Week
Volatility Expansion: This tight range will break soon. Watch Monday/Tuesday’s NY session.
US Economic Events: Any risk-off catalyst (rate hike talk, inflation data) could drag BTC lower.
Volume Profile: Low volume up = risk of fake out. Wait for clean confirmation.
Final Take
Bitcoin is building pressure. Whether it explodes or collapses depends entirely on how price behaves around the 109K ceiling. Until then, range strategies dominate but the first clean break will be the play of the week.
Disclaimer
Staakd and its content are strictly for educational and informational purposes only.
We are not financial advisors, brokers, or licensed investment professionals. All content published on this website, including blog posts, trade setups, charts, commentary, and visual media, reflects our own opinions and market analysis. It should not be interpreted as financial advice or a recommendation to buy or sell any financial instrument.
Trading futures, forex, and other leveraged products involves significant risk and is not suitable for every investor. You should carefully consider your level of experience, risk tolerance, and investment objectives before engaging in any trading activity. Always do your own research and consult with a qualified financial advisor before making any trading decisions. Staakd is not liable for any loss or damage arising directly or indirectly from reliance on any information provided on this site or in associated content. Past performance does not guarantee future results. By using this site, you acknowledge and agree to this disclaimer in full.
Current Market Structure
After a massive bounce off the 96,000–97,000 zone, BTC1 ripped higher and is now consolidating just below 109,000.
The structure shows a neutral range forming between roughly 109,000 (resistance) and 106,000 (support).
Buyers have defended the lower bound, but they’ve also failed to push above the upper bound — suggesting balance before expansion.
Key Levels
LevelZoneSignificanceResistance (R)108,800 – 109,800Supply zone. Price has failed to close above this range multiple times.Support (S)105,800 – 106,400Demand zone. Price bounced from this area several times; strong buyers here.Macro Pivot~103,000If broken, would confirm a shift back to bearish dominance.Upside Magnet~111,800–112,200If R breaks, price could rip toward this area quickly (inefficient zone).
Bias for the Week Ahead
Neutral to Bullish Bias
As long as BTC1 holds above 106,000, bulls remain in the game.
However, multiple rejections near resistance hint that institutional sellers are active.
A break of either side will likely trigger momentum and open up clean targets.
Trade Scenarios
Scenario 1: Bullish Breakout
Entry: Above 109,800 with strong momentum or breakout candle close
TP1: 111,800
TP2: 112,400+
SL: Below 108,500
This scenario plays the breakout and aims to capture the range expansion.
Scenario 2: Bearish Rejection from Resistance
Entry: Short around 109,400–109,800 if price rejects again
TP1: 106,600
TP2: 105,800
SL: Above 110,200
Ideal setup if BTC fails to gain strength early in the week and VIX or dollar strength returns.
Scenario 3: Range Play
Until a breakout occurs, the most likely scenario is continued chop between the marked zones.
Long near 106,000, SL under 105,500, TP near 108,800
Short near 109,800, SL above 110,200, TP near 106,400
This is suitable for day traders or range scalpers.
Summary Table
Bias Confidence Setup Trigger
✅ BullishModerateBreakout above 109,800
⚠️ BearishModerateRejection from 109,800 + loss of 106,000
⚪ NeutralHighWhile inside 106K–109K range
What to Watch This Week
Volatility Expansion: This tight range will break soon. Watch Monday/Tuesday’s NY session.
US Economic Events: Any risk-off catalyst (rate hike talk, inflation data) could drag BTC lower.
Volume Profile: Low volume up = risk of fake out. Wait for clean confirmation.
Final Take
Bitcoin is building pressure. Whether it explodes or collapses depends entirely on how price behaves around the 109K ceiling. Until then, range strategies dominate but the first clean break will be the play of the week.
Disclaimer
Staakd and its content are strictly for educational and informational purposes only.
We are not financial advisors, brokers, or licensed investment professionals. All content published on this website, including blog posts, trade setups, charts, commentary, and visual media, reflects our own opinions and market analysis. It should not be interpreted as financial advice or a recommendation to buy or sell any financial instrument.
Trading futures, forex, and other leveraged products involves significant risk and is not suitable for every investor. You should carefully consider your level of experience, risk tolerance, and investment objectives before engaging in any trading activity. Always do your own research and consult with a qualified financial advisor before making any trading decisions. Staakd is not liable for any loss or damage arising directly or indirectly from reliance on any information provided on this site or in associated content. Past performance does not guarantee future results. By using this site, you acknowledge and agree to this disclaimer in full.
Share
Copy link
Share
Copy link
Share
Copy link
Related


Built by traders. Run on proof.

© Staakd
2025
Sign up for real trades. No noise
Built by traders. Run on proof.
© Staakd
2025
Sign up for real trades. No noise
Built by traders. Run on proof.
© Staakd
2025
Sign up for real trades. No noise